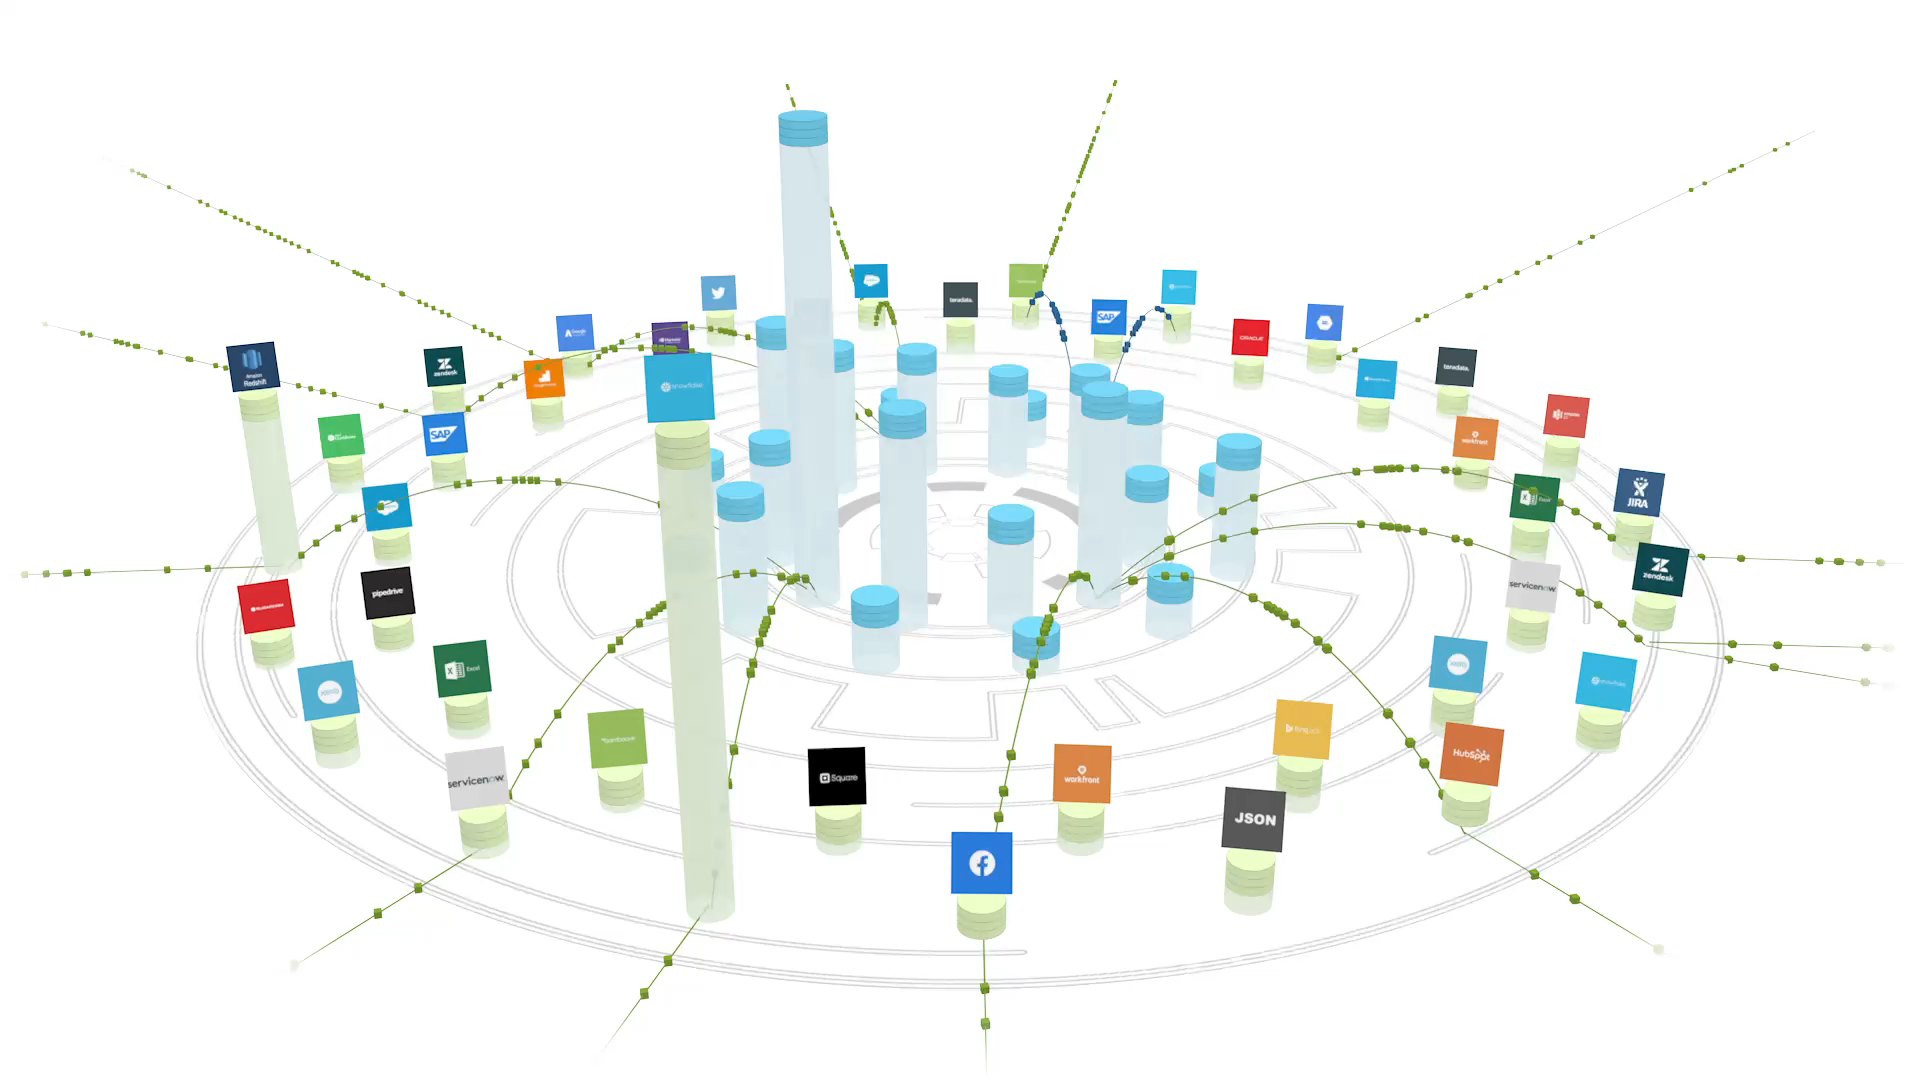
Spatial experience · Interaction & motion · Three.js
Making an invisible data ecosystem tangible, explorable, and alive.
The foundation
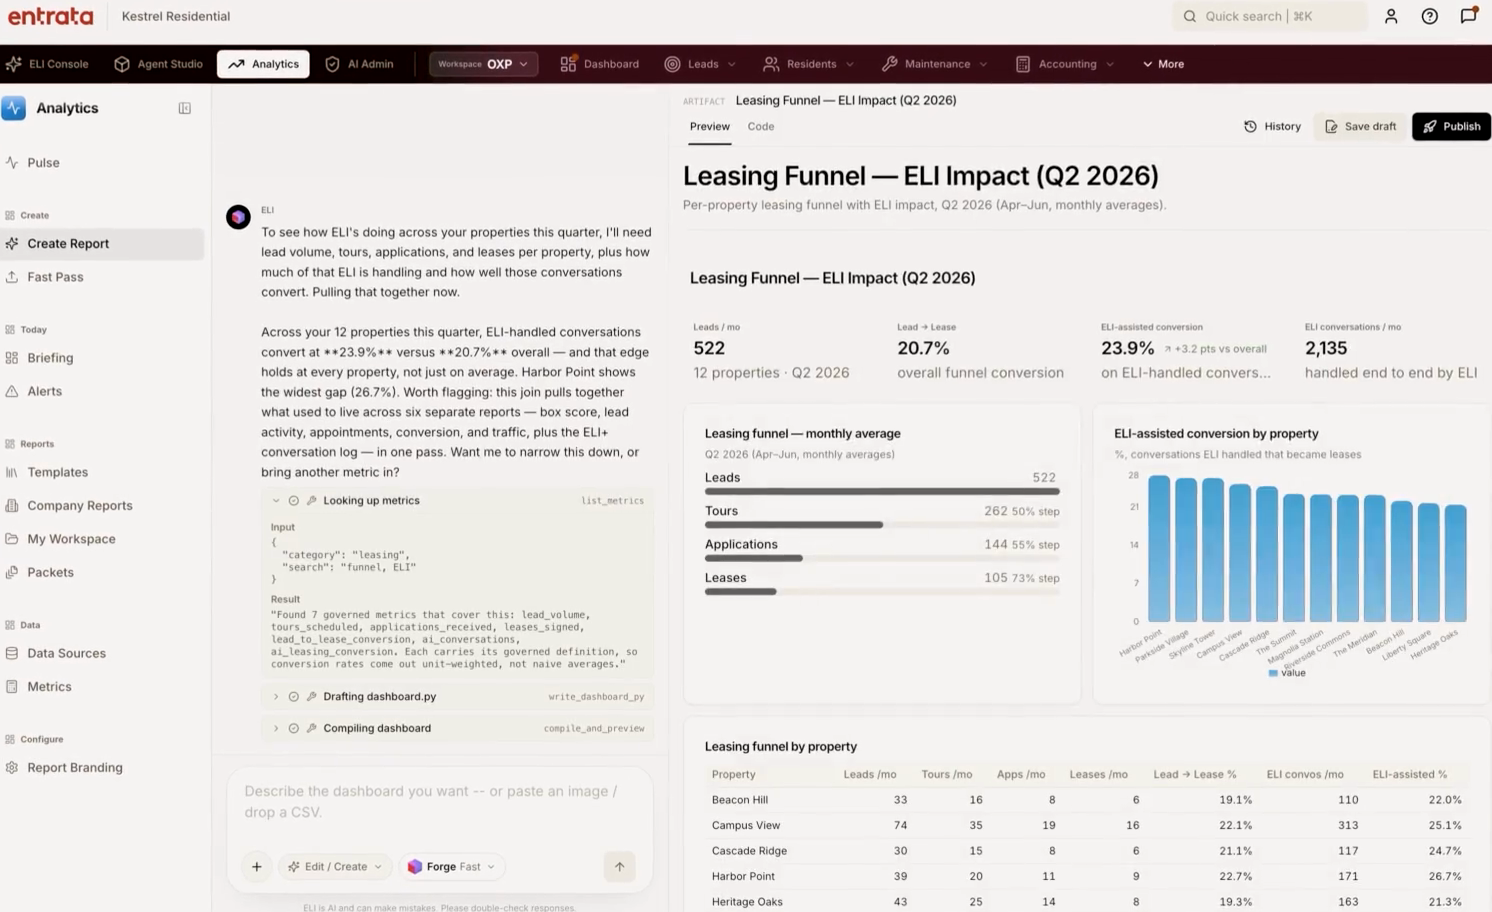
Analytics brings property and company data into reports, alerts, and daily briefings. Teams can ask questions, explore the results, and trace findings back to their sources.
The product preview connected report creation, saved definitions, and access-controlled queries. A report could be revisited, checked against its source data, and shared through review.
The model
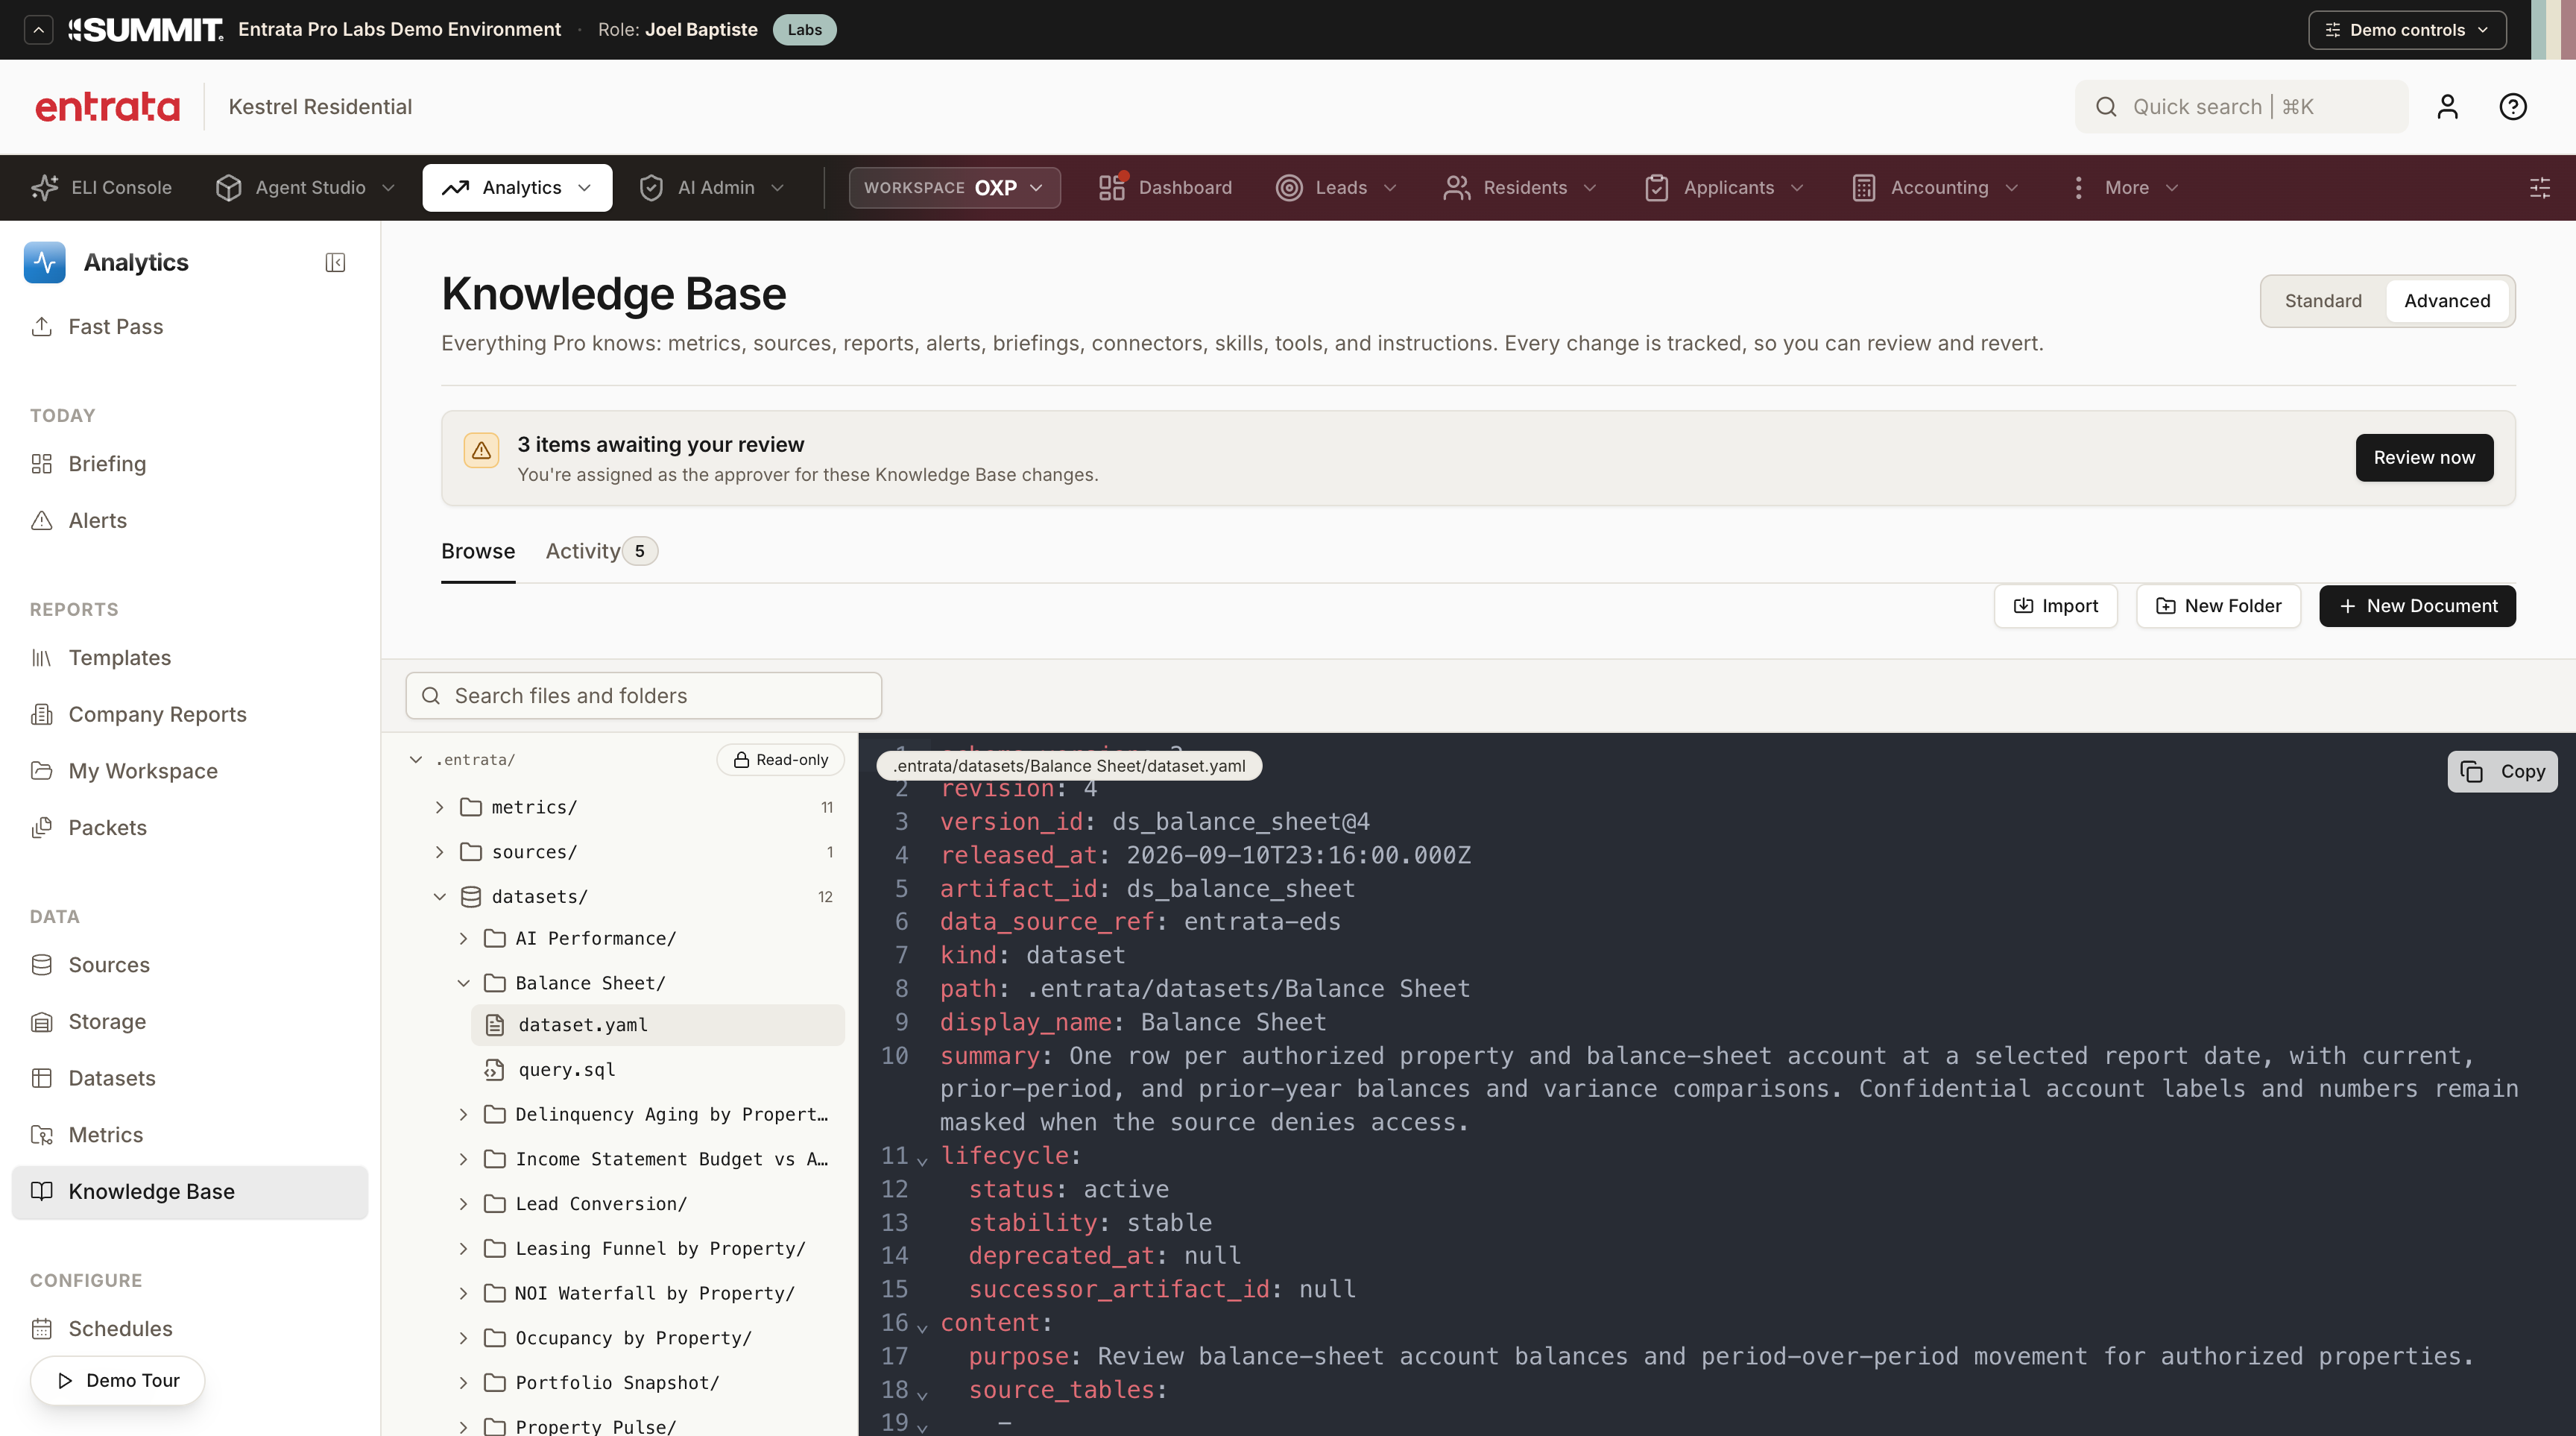
A Model defined which data to use, what each row represented, how current it was, and who could access it. A Report defined how to present those results through charts, tables, controls, and layout.
Report layouts were saved as declarative definitions and rendered by shared React components. Each saved report had a repeatable presentation, and teams could refine its layout while preserving the meaning of the data.
“I’ve loved what you’re doing for us. We’d love to do more with you.”
The result
Spatial experience · Interaction & motion · Three.js
Making an invisible data ecosystem tangible, explorable, and alive.
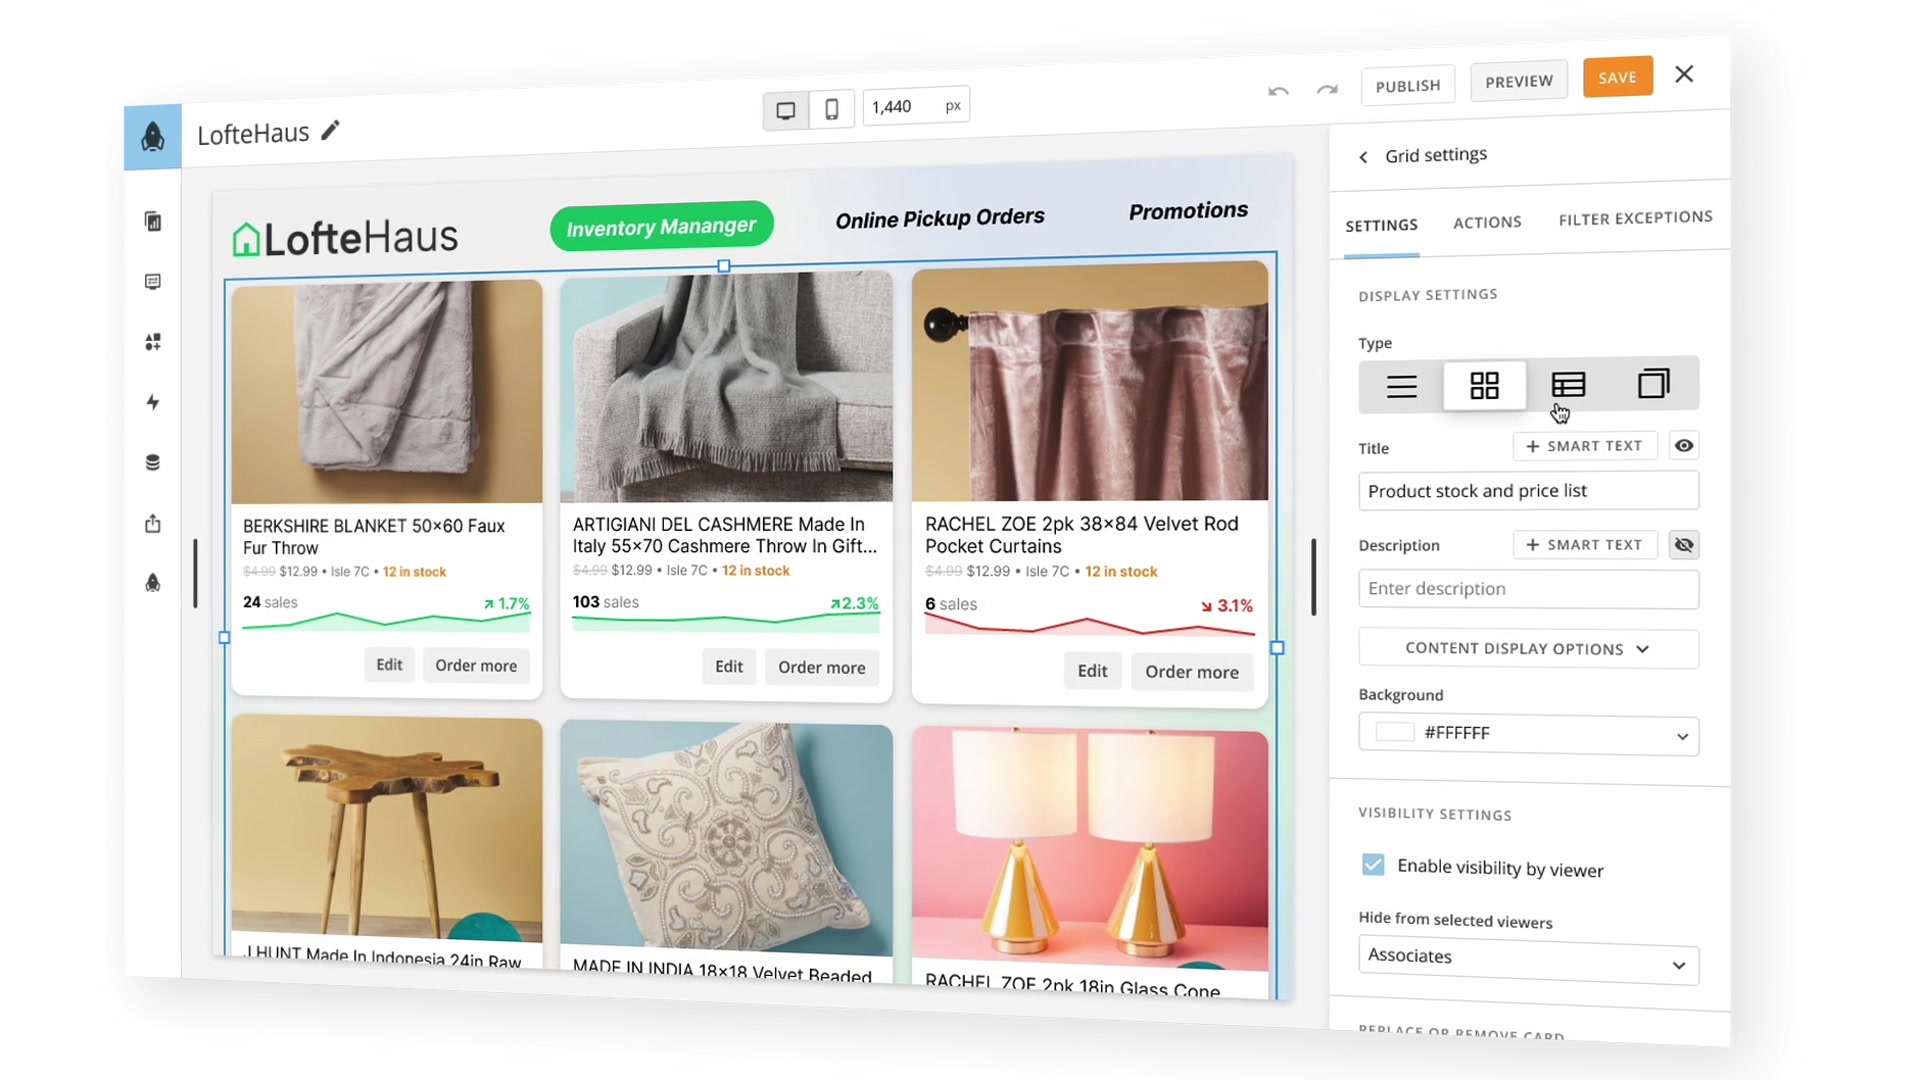
Layout architecture · Editor interactions · Mobile composition
A flexible foundation for turning dashboards into applications of your own.
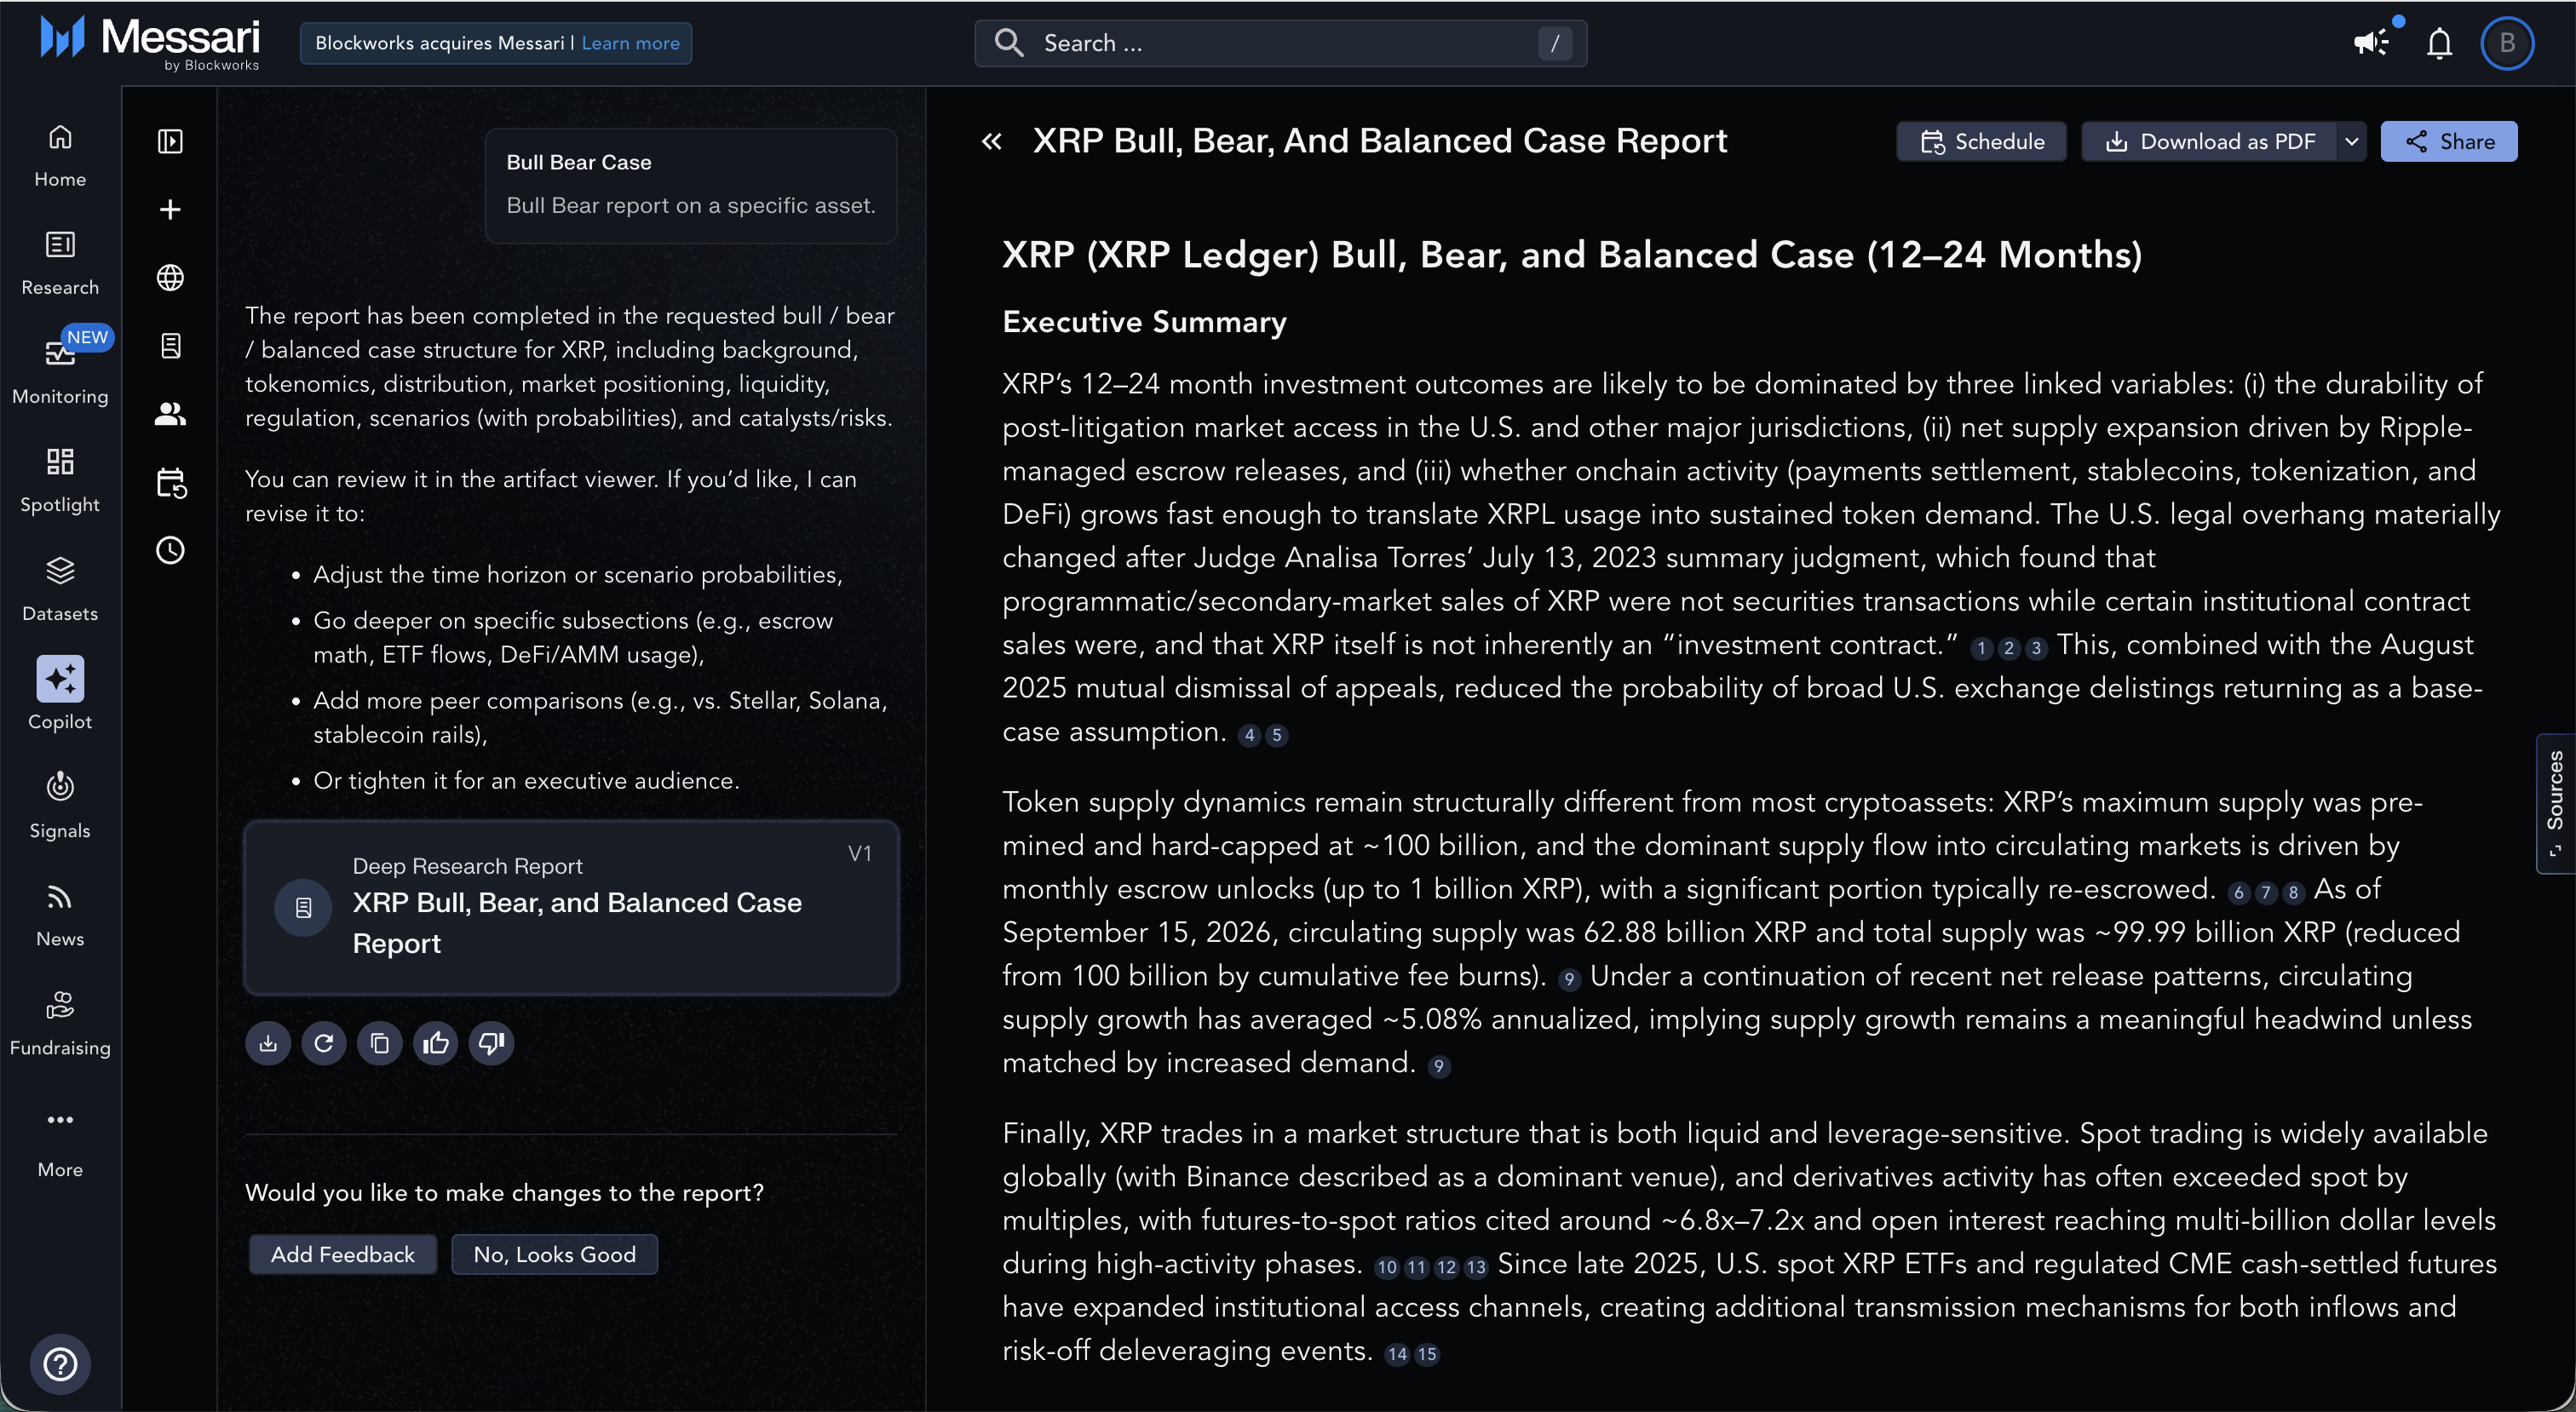
Frontend product ownership · Interaction design · Report experience
Turning an ambitious AI concept into research people could return to, inspect, and keep working with.